SPDE result extraction from INLA estimation results
inla.spde.result.RdExctract field and parameter values and distributions for an
inla.spde SPDE effect from an inla result object.
inla.spde.result(...)

inla.spde1.result(inla, name, spde, do.transform = TRUE, ...)

# S3 method for class 'inla.spde1'
inla.spde.result(inla, name, spde, do.transform = TRUE, ...)

inla.spde2.result(inla, name, spde, do.transform = TRUE, ...)

# S3 method for class 'inla.spde2'
inla.spde.result(inla, name, spde, do.transform = TRUE, ...)
Arguments
- ...
Further arguments passed to and from other methods.
- inla
An
inlaobject obtained from a call toinla()- name
A character string with the name of the SPDE effect in the inla formula.
- spde
The
inla.spdeobject used for the effect in the inla formula. (Note: this could have been stored in the inla output, but isn't.) Usually the result of a call toinla.spde2.matern().- do.transform
If
TRUE, also calculate marginals transformed to user-scale. Setting toFALSEis useful for large non-stationary models, as transforming many marginal densities is time-consuming.
Value
For inla.spde2 models, a list, where the nominal range and
variance are defined as the values that would have been obtained with a
stationary model and no boundary effects:
- marginals.kappa
Marginal densities for kappa
- marginals.log.kappa
Marginal densities for log(kappa)
- marginals.log.range.nominal
Marginal densities for log(range)
- marginals.log.tau
Marginal densities for log(tau)
- marginals.log.variance.nominal
Marginal densities for log(variance)
- marginals.range.nominal
Marginal densities for range
- marginals.tau
Marginal densities for tau
- marginals.theta
Marginal densities for the theta parameters
- marginals.values
Marginal densities for the field values
- marginals.variance.nominal
Marginal densities for variance
- summary.hyperpar
The SPDE related part of the inla hyperpar output summary
- summary.log.kappa
Summary statistics for log(kappa)
- summary.log.range.nominal
Summary statistics for log(range)
- summary.log.tau
Summary statistics for log(tau)
- summary.log.variance.nominal
Summary statistics for log(kappa)
- summary.theta
Summary statistics for the theta parameters
- summary.values
Summary statistics for the field values
See also
Examples
loc <- matrix(runif(100 * 2), 100, 2)
mesh <- fmesher::fm_mesh_2d_inla(loc.domain = loc, max.edge = c(0.1, 0.5))
spde <- inla.spde2.matern(mesh)
index <- inla.spde.make.index("spatial", mesh$n, n.repl = 2)
spatial.A <- inla.spde.make.A(mesh, loc,
index = rep(1:nrow(loc), 2),
repl = rep(1:2, each = nrow(loc))
)
## Toy example with no spatial correlation (range=zero)
y <- 10 + rnorm(100 * 2)
stack <- inla.stack(
data = list(y = y),
A = list(spatial.A),
effects = list(c(index, list(intercept = 1))),
tag = "tag"
)
data <- inla.stack.data(stack, spde = spde)
formula <- y ~ -1 + intercept + f(spatial,
model = spde,
replicate = spatial.repl
)
result <- inla(formula,
family = "gaussian", data = data,
control.predictor = list(A = inla.stack.A(stack))
)
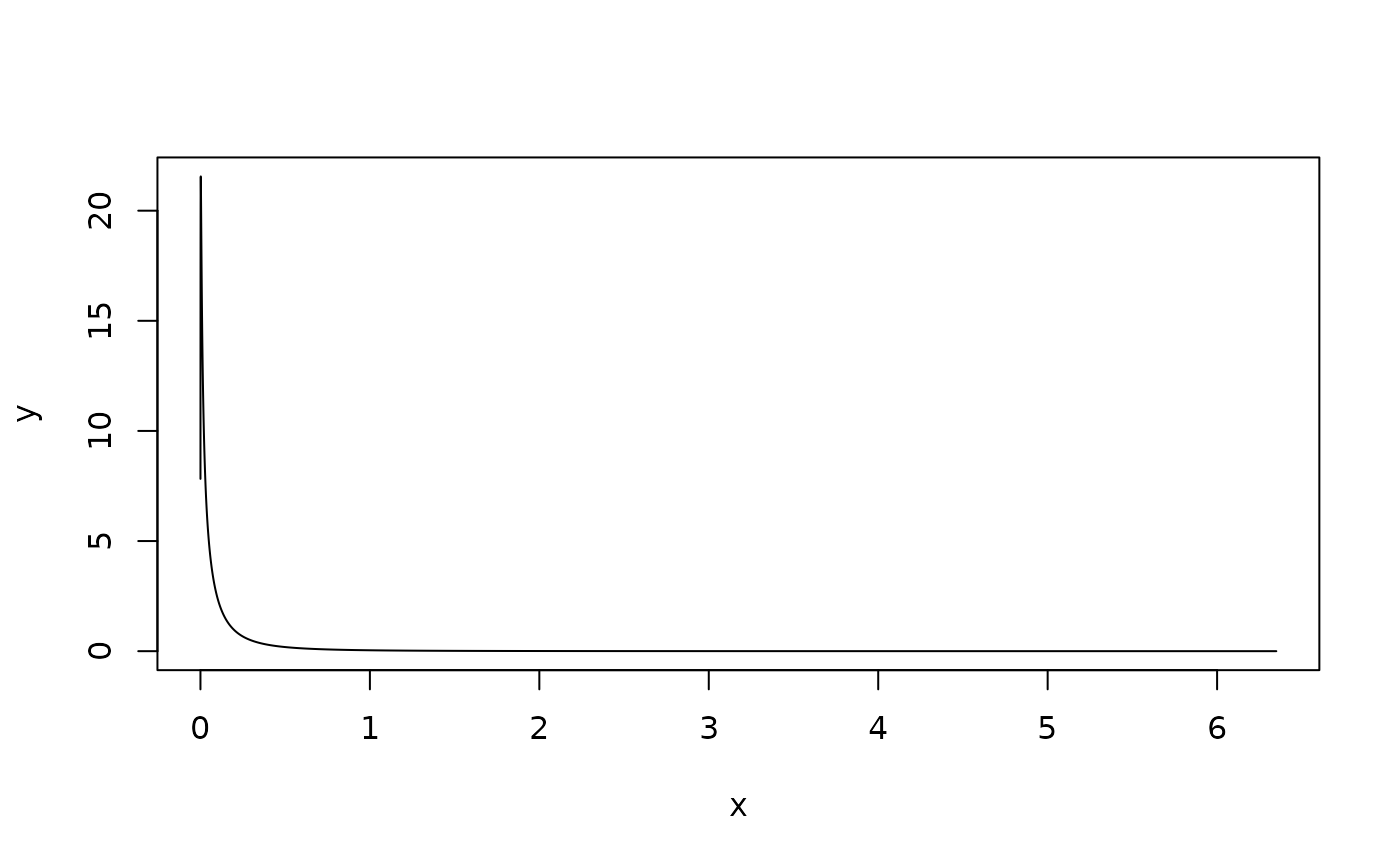
spde.result <- inla.spde.result(result, "spatial", spde)
plot(spde.result$marginals.range.nominal[[1]], type = "l")